Live Site: crashmap.io
GitHub: CrashMap Repo
A public-facing web application for visualizing crash data involving injuries and fatalities to bicyclists and pedestrians. Built with Next.js, Apollo GraphQL, Prisma, PostgreSQL/PostGIS, and Mapbox GL JS. The data is self-collected from state DOT websites and stored in Postgres.
Overview
Every year, bicyclists and pedestrians are injured or killed in preventable crashes. CrashMap puts that data on the map — literally. By visualizing crash records with severity, mode, date, and location filters, CrashMap helps advocates, planners, journalists, and concerned residents understand crash patterns and make the case for safer streets.
The application is built as a classic three-tier architecture (Client → GraphQL API → PostgreSQL database), deployed as a single Next.js application on Render. All crash data is open and publicly accessible — no account required.
Data
Crash data is sourced from the WSDOT Crash Data Portal via the ESRI feature API. The esri-exporter companion tool handles fetching records, converting them to SQL, and generating import files for the database.
Features
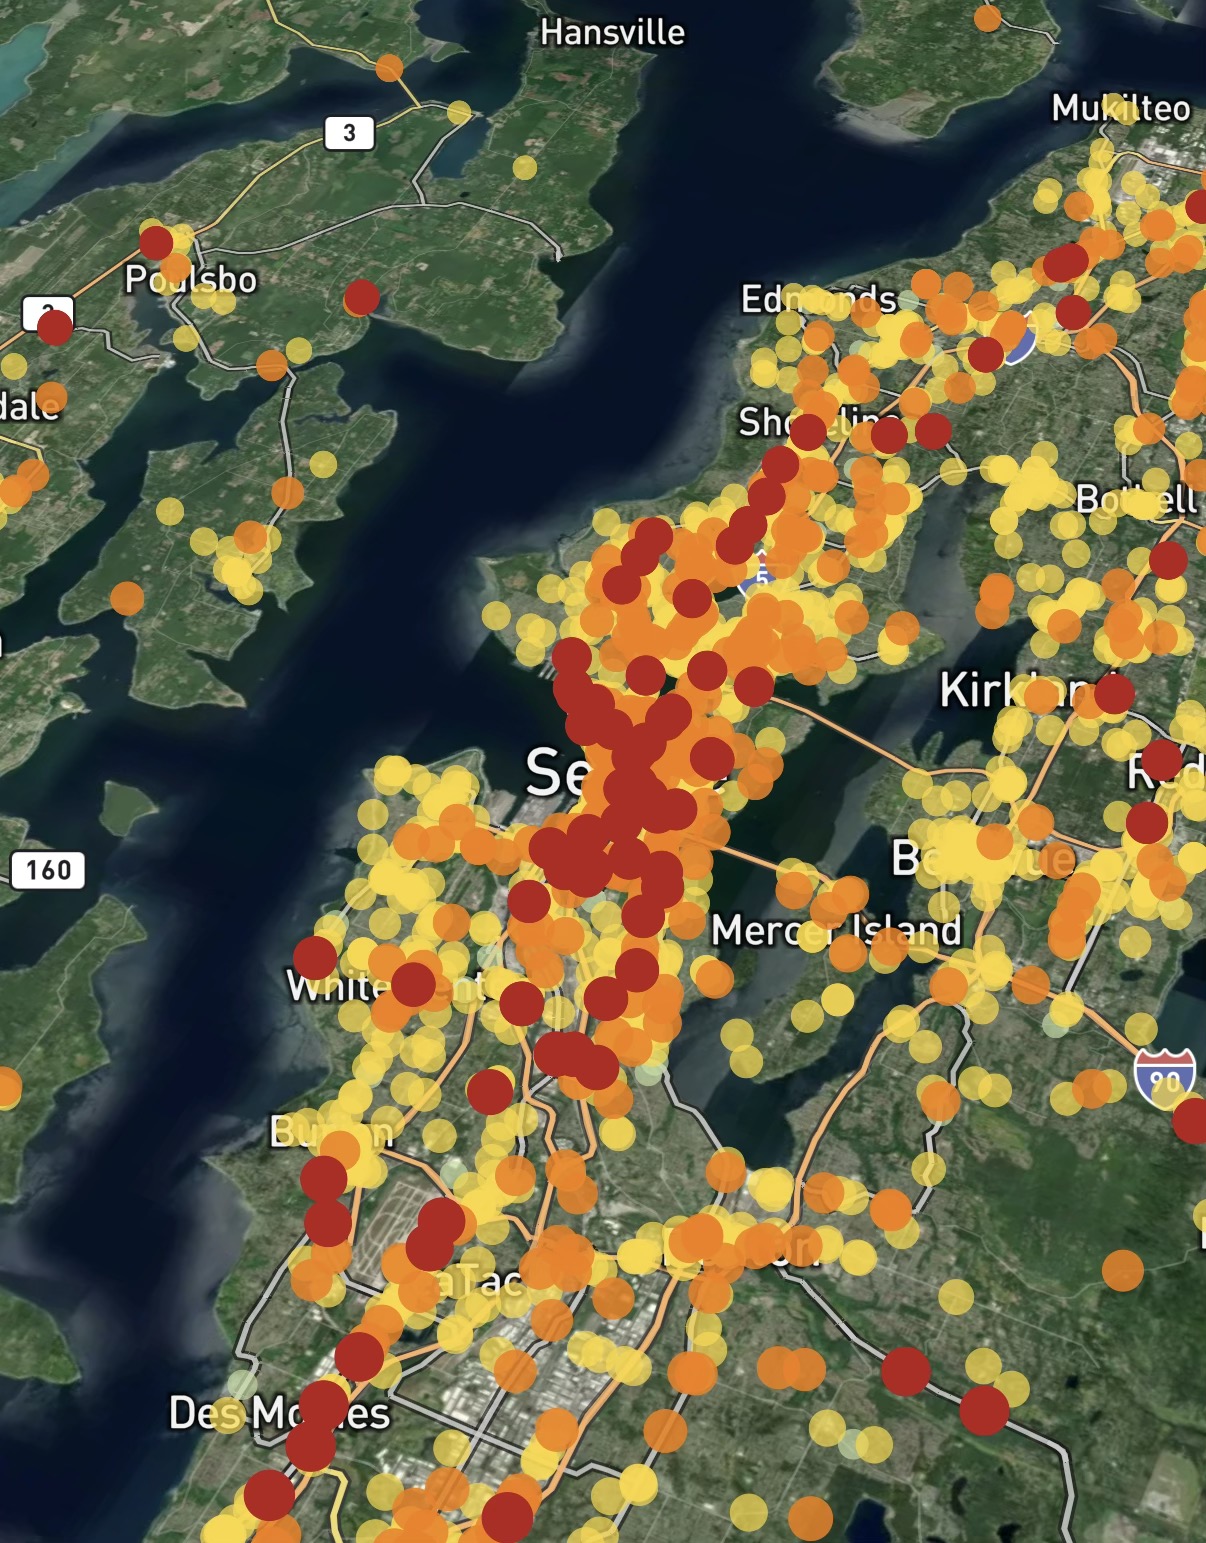
- Crash locations rendered as color-coded dots using Mapbox GL JS, with severity visible at a glance
- Click any crash dot to view a detailed popup: date, time, injury type, mode, city/county, jurisdiction, involved persons, and - collision report number
- Popup includes links to Apple Maps and Google Street View for the crash location
- Copy the collision report number to clipboard directly from the popup
- 3D tilt view (pitch 45°) and zoom controls built into the map
- Satellite imagery toggle for aerial context